




Risk Mapping
Risk Mapping organizes identified and scored risks across the AI project lifecycle to provide a clear, structured view of where risks exist, how they relate, and where exposure is concentrated.
It enables a more complete understanding of risk beyond individual issues by showing how risks interact across stages and roles. Mapping follows risk scoring and sits inside the same lifecycle framework.
Purpose of Risk Mapping
Making Risk Visible Across the Project
Individual risk signals can be difficult to interpret in isolation.
Risk mapping places these signals within a structured view of the project.
This allows:
- Visualization of where risks are located
- Identification of patterns across stages
- Recognition of relationships between risks
Mapping Risks Across Lifecycle Stages
Stage-Based Risk Distribution
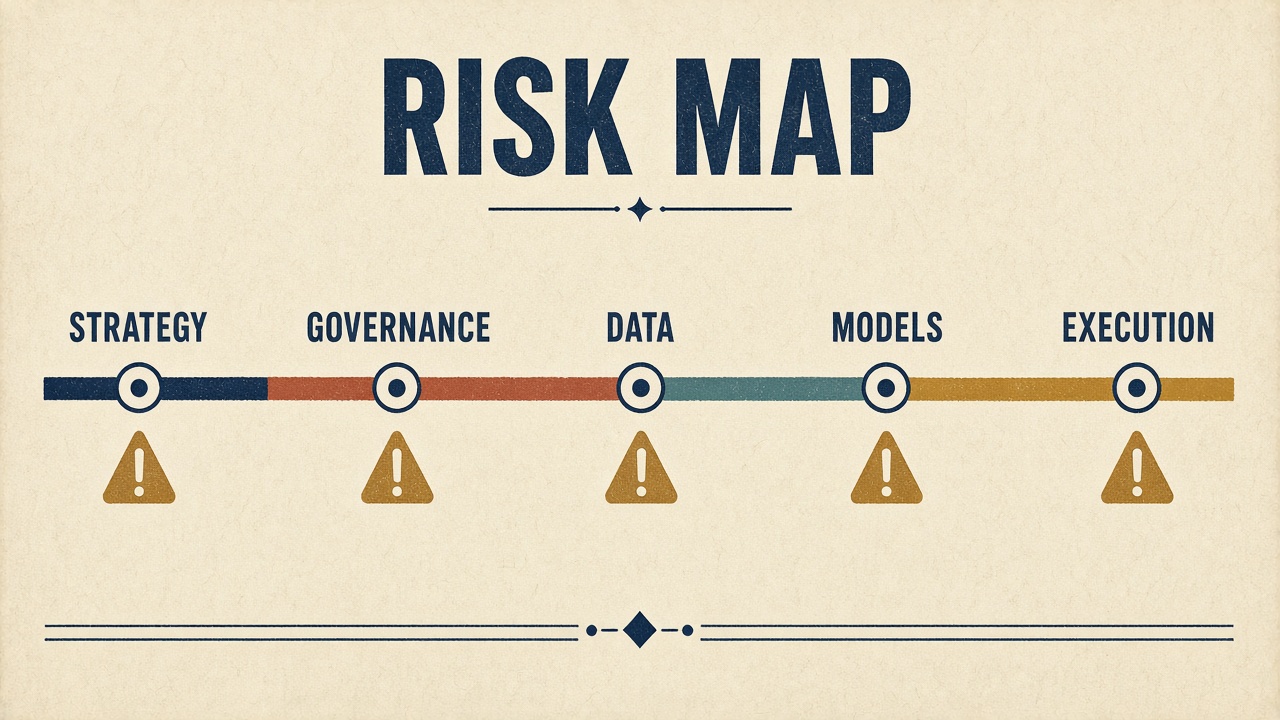
Risks are mapped to the stage where they originate:
- Strategy
- Governance
- Data
- Models
- Execution
This highlights which stages carry the highest concentration of risk, and where early-stage issues may influence later outcomes.
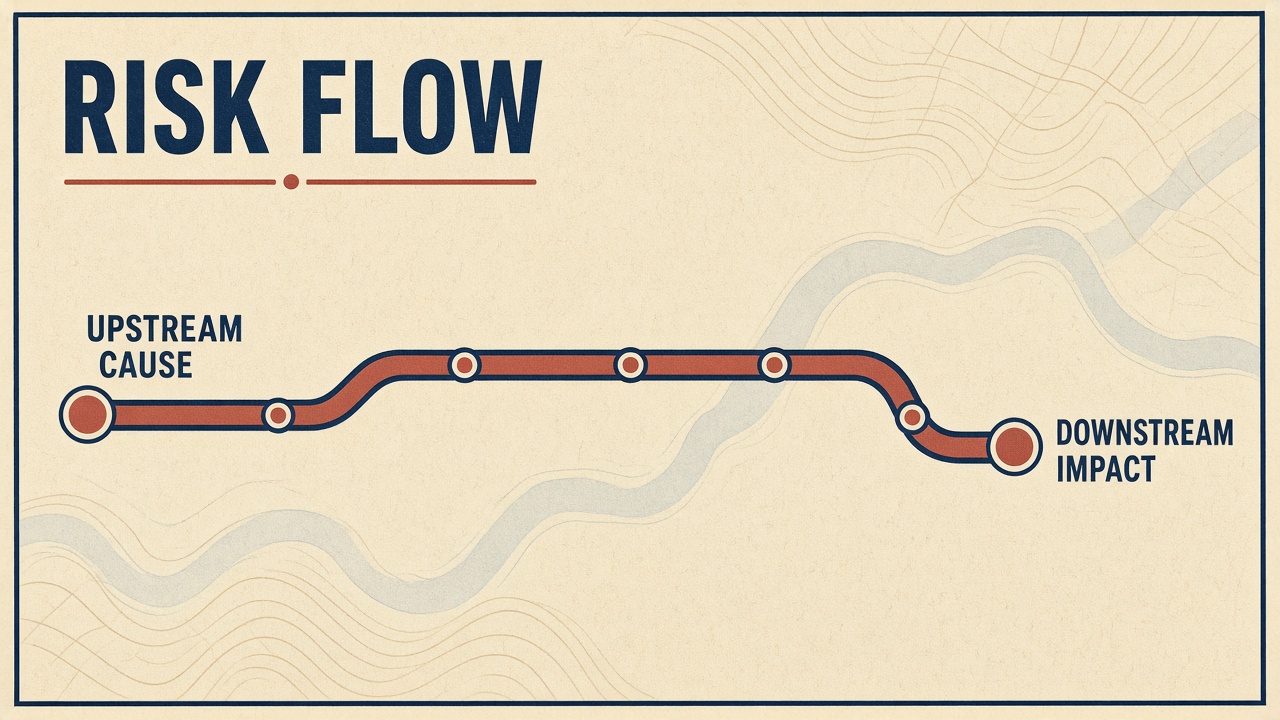
Linking Upstream and Downstream Effects
Risk mapping connects:
- Upstream causes (for example, data limitations)
- Downstream impacts (for example, execution delays)
This provides visibility into how risks propagate across the project, consistent with the risk assessment.
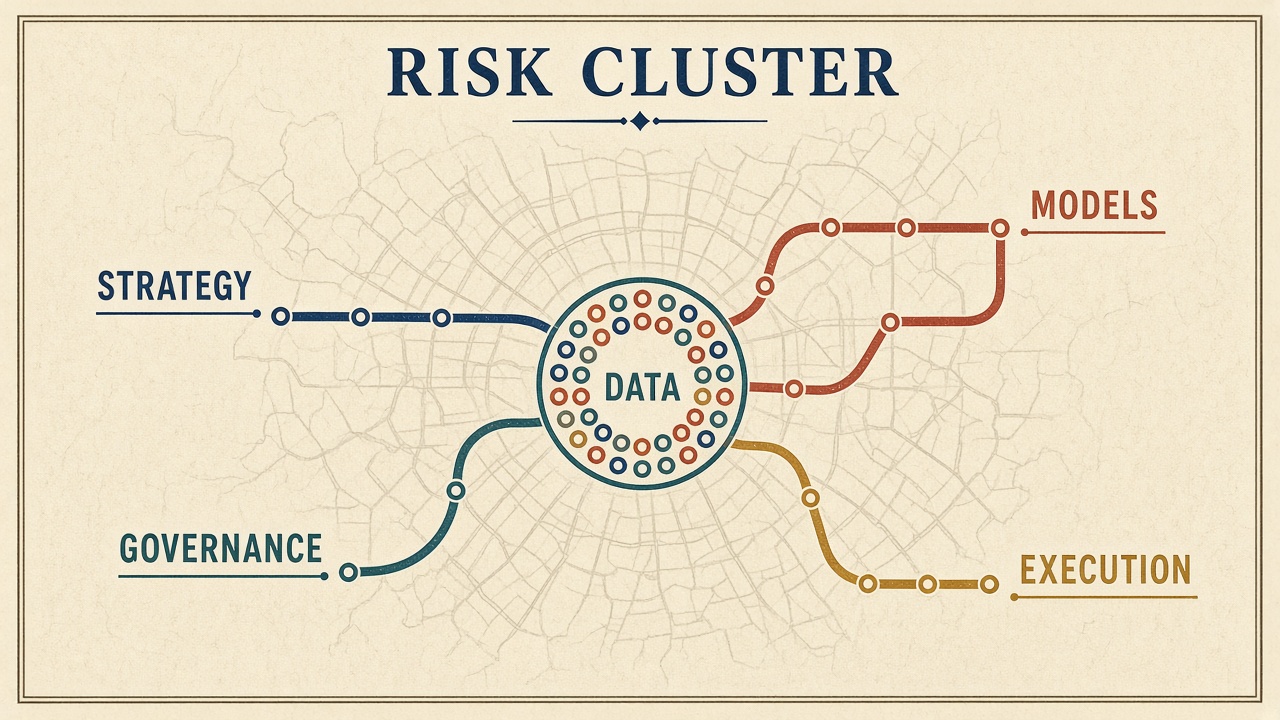
Identifying Risk Concentration Areas
Clusters of Risk
When multiple risks are mapped to:
- A specific stage
- A shared dependency
- A common assumption
They form risk clusters, indicating concentrated exposure.
Interpreting Concentration
Risk concentration may indicate:
- Structural weaknesses in a stage
- Repeated misalignment across teams
- Dependency on unresolved conditions
These clusters often represent areas requiring closer attention.
Mapping Relationships Between Risks
Interconnected Risks
Risks are not always independent.
Some risks influence or reinforce others.
Examples:
- Data quality issues increasing model risk
- Governance gaps affecting execution decisions
- Misalignment increasing probability across multiple risks
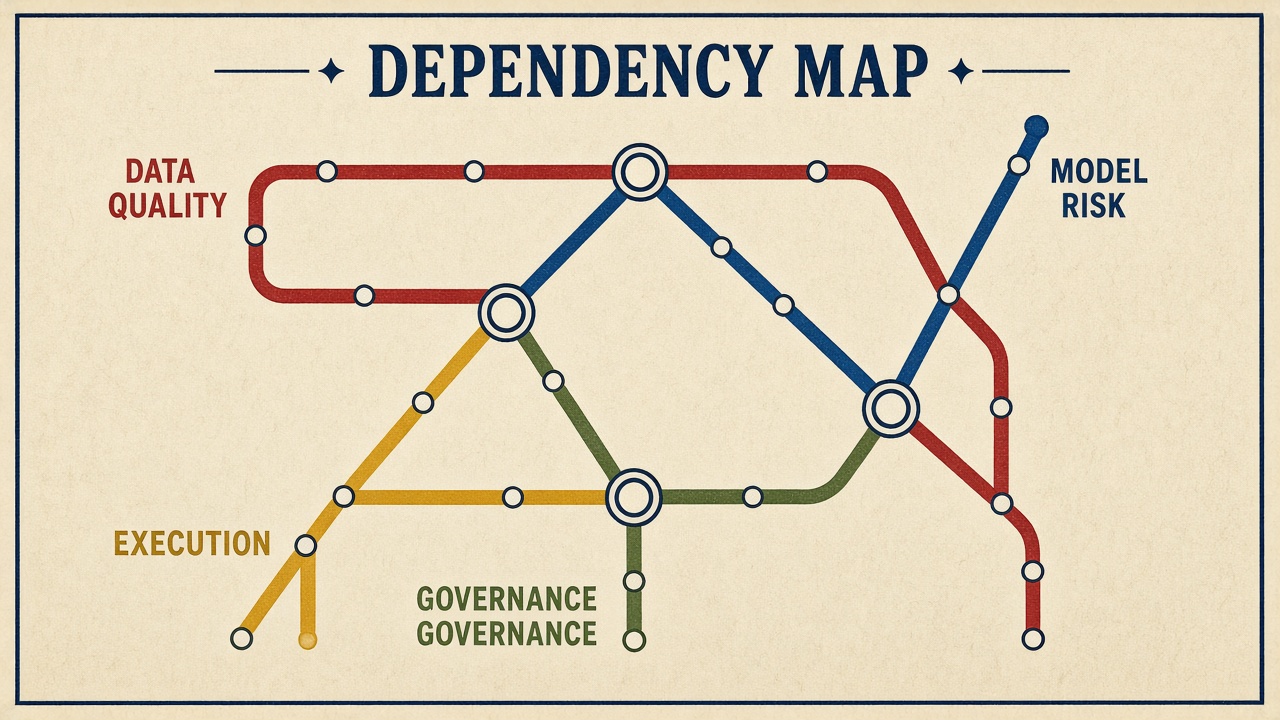
Dependency Mapping
The mapping process identifies:
- Which risks depend on others
- Which risks amplify each other
- Where multiple risks share a common root cause
This reveals the structure of risk within the project.
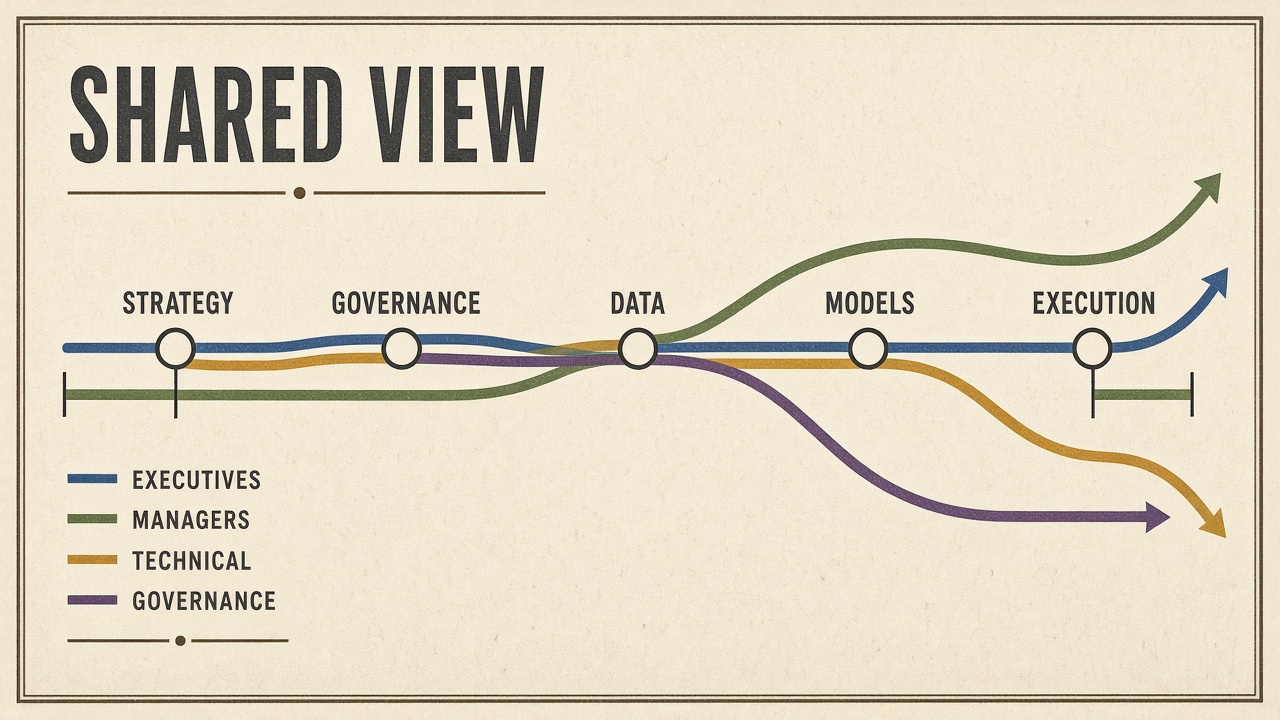
Cross-Role Risk Visibility
Differences in Stakeholder Perspective
Risk mapping reflects inputs from different roles:
- Executives
- Managers
- Technical teams
- Governance and compliance
Differences in how risks are perceived can reveal gaps in understanding, misalignment in priorities, and incomplete visibility.
Aligning Perspectives Through Mapping
By placing risks in a shared structure:
- Differences become visible
- Overlaps can be identified
- Blind spots can be highlighted
This supports a more consistent understanding across stakeholders and later executive decisions.
From Risk Mapping to Insight
Pattern Recognition
Mapping enables identification of:
- Recurring issues across stages
- Dependencies that affect multiple outcomes
- Areas where risk signals converge
Contextual Understanding
Rather than viewing risks individually, mapping provides:
- Context for each risk
- Relationship to other risks
- Position within the overall project
This improves the ability to interpret risk meaningfully.
Why Risk Mapping Matters
Moving Beyond Isolated Risks
Without mapping:
- Risks appear fragmented
- Relationships are missed
- Root causes remain unclear
Enabling Structured Decision-Making
With mapping:
- Risk exposure becomes more visible
- Dependencies are easier to understand
- Attention can be directed to areas of highest concentration